What Makes An Accurate Toddler Growth Chart?
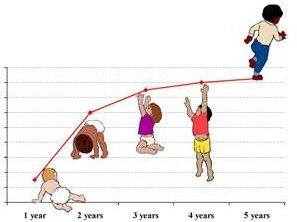
A toddler growth chart is a simple graph that shows the way your child grows over time. It’s a very useful way to see that your child is growing as he should.
It’s easy to play the ‘comparison game’ and compare our toddler with everyone else’s Jake, John, and Sue. When we do, we can easily get worried over things that are nothing more than normal differences between individual children. Children aren’t meant to all be one cookie cutter shape, and they all have their growth spurts timed differently.

A growth chart helps you focus on your child’s own growth curve--- the rate at which he is growing—enabling you to make sure it is within normal limits. The shape of the curve is much more important than your child’s absolute weight or height. If the curve has a normal slope, your child is probably doing just fine. If it plummets down at any one point or levels off before it should, you will need to figure out what is wrong.
Plotting Your Child’s Data on a Growth Chart
It’s easy to set up a growth chart for your child—all you need is several height/weight measurements taken at different times, with the exact date when the measurements were taken. It’s best if those dates are spread out by a month or several months, but even if you just have your child’s height/weight data for today you can still set up your chart and put the first point on it – you’ll just have to wait until you’ve had a chance to add more points before you can get an idea of what your child’s curve looks like.
Download and print out a growth chart for your little girl or boy. If your toddler is not yet two, you’ll want to download the appropriate World Health Organization Chart from the CDC WHO page. The chart you want is ‘Length-for-age percentiles and Weight-for-age percentiles’. Be aware that boys and girls grow differently, and you’ll need to choose the right one for your child.
If your toddler is older than two, print out a CDC charts that will enable you to record your child’s growth.
Both of these are geared toward children growing up in the United States; if you call another country home, you may want to look for your country’s recommended toddler growth chart.
Once you have that printed all you need to do is put in your child’s information. On the horizontal line, find your child’s age in months. On the horizontal lines, find your child’s current height and weight. Make a little mark where your child’s height and weight horizontal lines meet the vertical line of his or her age. After you have several data points, connect them with a smooth curve.
Weighing Your Child for a Growth Chart
To get the most reliable data, it’s best if you weigh your child in a consistent way:
• Use the same scale each time
• Weigh at the same time of day
• Wear clothes of similar weight each time.
Light clothes are okay, but your toddler shouldn’t be wearing a full diaper or heavy clothes or shoes when being weighed for his growth chart.
Measuring Your Child for a Growth Chart
Measure your toddler for his growth chart by having him stand up against a wall, heels back against the wall, head facing forward. Put a book flat on top of his head, and note the place where the book meets the wall (the underside of the book). Make a little pencil mark there.
Have your child step away and use a measuring tape to measure how high on the wall the mark you made was. This is your child’s height. Your child should not be wearing shoes or sandals when taking these measurements.
Understanding a Toddler Growth Chart
There are two important parts of a toddler growth chart. One is simply the shape of the curve; by looking at that curve and comparing it with the standard curves drawn on your growth chart you can check that your child is growing as he should.
The other is the percentiles, which has to do with how your child compares in height and weight to the rest of the population. You can see whether the curve on your toddler’s growth chart is at the 95th percentile, or 50th percentile, or 25th. 95th percentile would mean that your child’s weight or height is more than that of 95% of the population. 25th percentile means that 75% of other children are heavier or taller than your child, but 25% of normal, healthy children are lighter or shorter.
Remember, your child isn’t in a growth competition. Use your toddler’s growth chart as a guideline to see how your child is doing, but don’t forget that it’s most important for him to be growing normally, not to be the same, heavier, or lighter than any other child—or any other group of children.
New! Comments
Have your say about what you just read! Leave me a comment in the box below.